My Friend Gandalf
As a financial advisor, I’m often asked where the markets are headed. Unfortunately, my crystal ball, affectionately named “Gandalf,” has been cracked and in the shop for years; frankly, I’m beginning to think I’ll never see Gandalf again. So, I’m forced to seek guidance from my second favorite source – data. It turns out that if you’re a true, long-term investor, the answer is probably “up”. Please hold your applause.
If markets historically go up, then why is almost everyone I talk to so down on the outlook? Maybe it’s the election. Maybe it’s (easing) inflation. Maybe it’s geopolitics or war. Maybe it’s more distant concerns about the future of the dollar or global warming. Or maybe it’s just agita or last night’s Kung Pao chicken.
But what if we’re all wrong, and the outlook is actually pretty good? Let’s look at a couple of reasons to be optimistic.
As noted in previous newsletters (probably also using data rather than Gandalf), looking back to 1950, the average bull market lasted roughly five calendar years (1131 trading days), while the average bear market lasted just 221 trading days (roughly one year for all of you engineers). For those of you keeping track at home, the current bull market began in October of 2022, so we’re roughly 500 trading days into the current bull market. I think that means we have another 600+ days in this bull market, but I’m not good with numbers and not allowed to make guarantees.
Looking at shorter-term performance in months rather than years (something Gandalf used to excel at), we can see what happens during periods of falling interest rates. Since 1929, there have been 14 rate-cutting cycles. 12 of these led to positive returns in the subsequent 12 months (after the first rate cut). Notably, both of the negative returns occurred more recently, one with the Tech Crash and the other with The Great Recession. Interestingly, since 1976, when rates have fallen over a six-month period, the US stock market has gained an average of 13.65%, and US Small Value stocks up 19.44%!
Yet to paraphrase my fellow Missourian, Mark Twain, there are lies, damned lies, and statistics. Gandalf was always honest with me. Sure, I could have provided data (or even pretty graphs) to support a more negative outlook, but it would have weakened my argument, and it turns out, that none of this really matters if we just look at returns for true (read: long-term) investors.
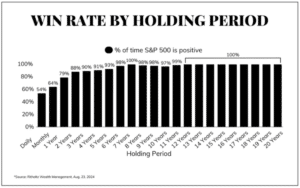
I’ve written repeatedly about the importance of “zooming out” and looking at returns over the long term: It’s why I tell people not to invest in the markets if their time horizon is anything under 5 years. Here’s one of my favorite investing graphs, showing clearly that since 1950, investing in the S&P500 over a period of just 6 years led to positive returns 98% of the time. 98%! Unfortunately, as investors, we allow our minds and emotions to take over and try outsmart the markets. And, as you may know, it turns out that our emotions are pretty bad investors. If there’s one thing I take from this data, it’s that bar charts are probably my favorite kinds of charts. If there’s anything else, it’s the importance of ignoring the media, putting the newspaper down and, for all that is good and true in this world, do not watch Jim Cramer. Anyway, I have it on good authority that his Gandalf is also in the shop.

