In my 3rd quarter newsletter for 2022, I mentioned that models from Bloomberg Economics put the odds of a recession within one year at nearly 100%. I’m not much of a gambler, but I believe those are good odds.
Oops.
2023 ended the year with a bang! No, that doesn’t mean the economy was exceptionally strong (the economy is not the market!), but it was stronger and more resilient than expected. The S&P500 index, comprised of large, US companies, was up just over 24%, and the Dow Jones Industrial Average, just 30 stocks US stocks, gained over 13%. But it was the tech-heavy, highly-concentrated Nasdaq that stole the show, up 40%, driven in large part by the magnificent 7 or M7 (Apple, Microsoft, Amazon, Nvidia, Alphabet, Tesla and Meta).
Worried you don’t hold those winners? Enter cap-weighted indexes. These are indexes where the components’ weightings are in proportion to the size of the company. Even if you don’t hold the individual stocks, you probably have a significant allocation to them if you’re invested in (cap-weighted) US mutual funds or exchange-traded funds (ETFs). At the beginning of 2024, the M7 accounted for almost 30% of the S&P500 and nearly 40% of the Nasdaq, and that’s after they rebalanced the index to reduce the concentration from over 50%!
So, should you sell everything and load up on even more M7? “Hard no,” the youngsters say. Stop chasing performance, and stop comparing your performance to highly publicized, non-diversified benchmarks!
On a personal note, my portfolio was not up 40% last year (or close), and I’m guessing yours wasn’t either. As I wrote a few months ago, the problem with diversification is always having to apologize for average performance. And yet, even after years like 2023, or even because of these years, I still believe the best way to reach your long-term objectives is through low-cost, globally diversified portfolios; the fact that one highly-publicized and nowhere-near-diversified sector of the market did well, does little to convince me otherwise.
Zooming out, it’s important to recognize that patterns play out over time in the markets over long periods (in this case, I’m arbitrarily defining “long” as 10+ years).
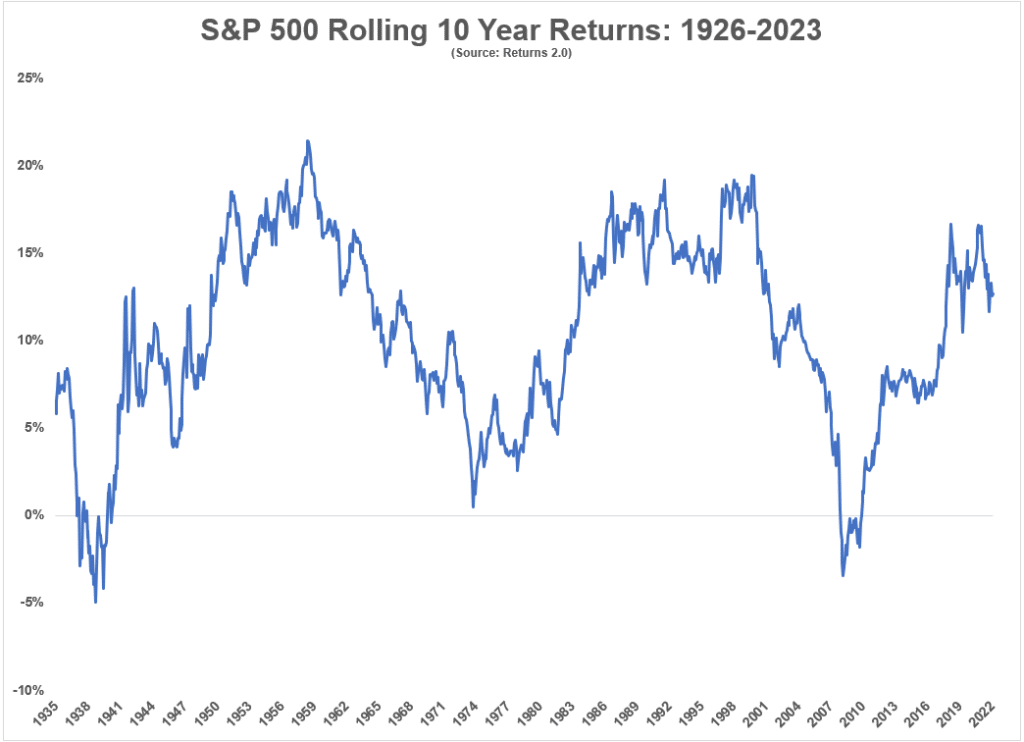
Over the course of the past 10 years, US large-cap stocks, as measured by the S&P 500, have produced an annualized return of almost 12%!
A quick glance at the chart below will show you how 10-year rolling returns (i.e., January 2000 to January 2010, then February 2000 to February 2010, etc) tend to move in cycles, and that once you have a high 10-year annualized return, between 15% and 20%, you can expect the subsequent 10 years to be lower.

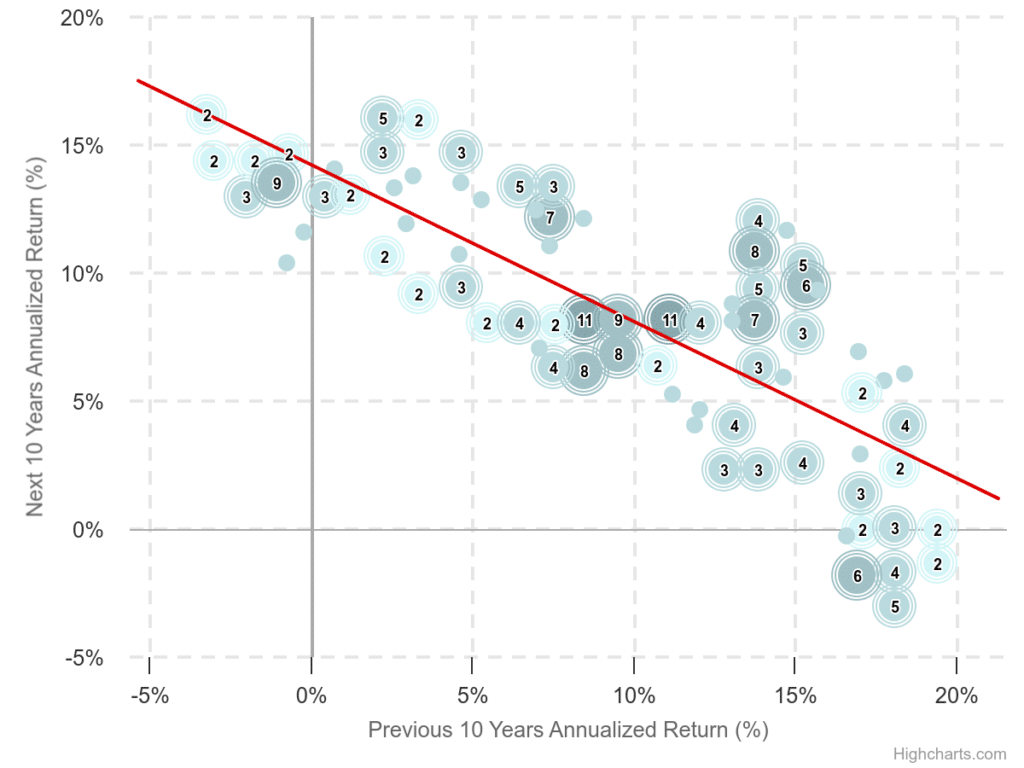
You can see the relationship between prior 10-year market performance and subsequent 10-year performance by viewing the strong negative correlation below. When markets return 10-20% over a 10-year period, it’s rare to see similar returns over the subsequent 10-year period.

I’m not calling a top to the market. Nor am I predicting a recession within the next year, or suggestion the M7 should be removed from your portfolios. I share these charts and information with the intent of highlighting that:
- Markets tend to move in cycles, and periods of high returns are generally followed by periods of lower returns, and vice versa.
- Though not shown, this often occurs with escalator-up, elevator-down speed, meaning sharp drop-offs over the course of just a year or two (or a few months in 2020), followed by subsequent Bull Markets.
- As volatility increases and markets sell off (the two are necessarily intertwined), your expected return goes up.
In April of 2022 I wrote that “I believe in the power of long-term markets, good diversification, and poor performance as a result of short-term market prognosticating,” and I stand by those tenets today.
